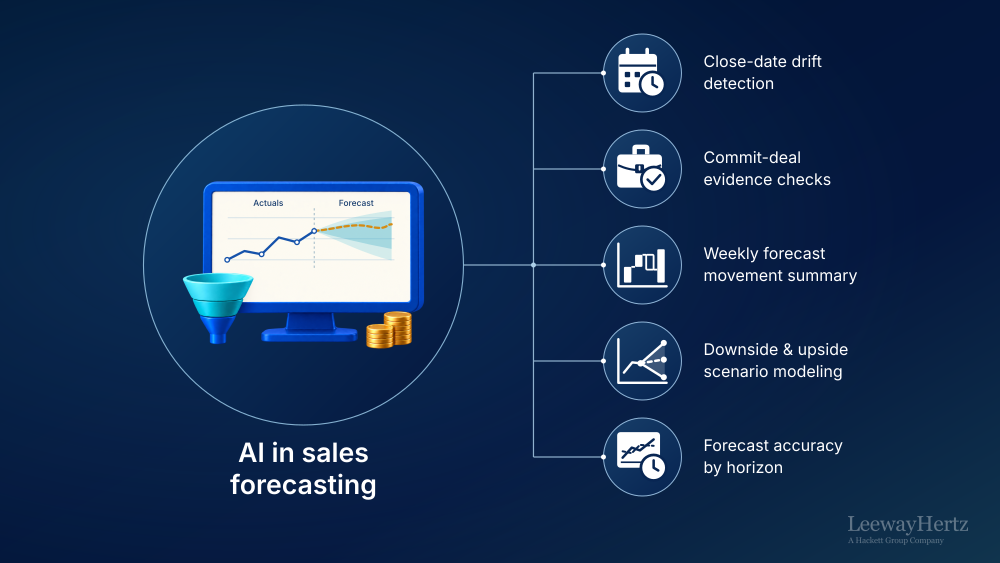
Sales forecasting is the discipline of estimating future commercial performance so organizations can plan revenue, allocate resources, manage capacity, and communicate business expectations. It converts opportunity, renewal, consumption, and historical performance data into a time-bounded view of expected outcomes. Depending on the business model, teams may forecast bookings, annual recurring revenue (ARR), renewals, consumption, or recognized revenue. These measures support different business decisions and should not be treated as interchangeable, making a well-defined forecasting process essential for consistent planning and execution.
Forecast quality depends on more than pipeline volume. Teams need consistent forecast categories, reliable close dates, point-in-time snapshots, deal-level evidence, renewal and consumption signals, and documented management judgment. Forecast categories (such as Commit, Best Case, Pipeline, or Omitted) indicate the sales team’s confidence that an opportunity will close within the forecast period. Opportunity stages, by contrast, describe the deal’s progress through the sales process.
AI can strengthen this work by identifying stale or repeatedly pushed opportunities, checking qualification and close-plan evidence, estimating close probability and timing, comparing human and statistical forecasts, modeling downside and upside scenarios, forecasting renewals and consumption, and explaining forecast-to-actual variance.
The value is not in replacing the forecast call with an AI model. A first-line sales manager still decides whether a deal belongs in Commit. A regional sales director still owns the regional call. The chief revenue officer owns the sales forecast. FP&A and revenue accounting retain responsibility for finance planning and revenue treatment.
Because forecasting is a cross-functional operating process rather than a single activity, AI opportunities differ across each part of the workflow. Forecast policy, pipeline integrity, deal inspection, forecast submission, statistical prediction, risk review, renewals, consumption forecasting, finance reconciliation, executive review, and forecast accuracy all rely on different data, artifacts, calculations, reviewers, and decision boundaries. Mapping AI to this operating model makes it possible to automate evidence gathering and analysis while preserving human ownership of forecast commitments and financial decisions.
This article breaks sales forecasting operating model functions into processes and sub-processes so AI opportunities can be mapped to the specific forecasting work where they can improve evidence, prediction, review, and decision preparation.
- How AI is transforming sales forecasting
- Why AI use cases in sales forecasting must be mapped at the sub-process level
- Sales forecasting operating model and AI opportunity mapping across forecasting processes
- High-value AI use cases in sales forecasting
- How agentic AI works in sales forecasting workflows
- How to prioritize AI use cases in sales forecasting
- Governance, risk, and responsible AI in sales forecasting
- How ZBrain operationalizes AI use cases in sales forecasting
- Future of AI in sales forecasting
How AI is transforming sales forecasting
AI changes sales forecasting by making the forecast evidence more continuous, granular, and inspectable. Instead of relying only on a weekly manager call, AI can compare the current forecast submission with the point-in-time pipeline snapshot, recent stage movement, close-date changes, deal qualification evidence, renewal status, consumption patterns, and prior forecast behavior.
Consider a quarter-end enterprise deal listed in Commit. The opportunity may show a current-quarter close date, but the stage has not changed for three weeks, the economic buyer has not appeared in recent deal evidence, the mutual action plan still contains unresolved legal and procurement milestones, and the close date has already moved twice. AI can assemble those signals into a risk packet and estimate the effect of a slip. The regional sales director still decides whether the deal remains in Commit.
The same principle applies above the deal level. A regional or business-unit forecastmay appear adequately covered in aggregate while depending heavily on three transactions. Another segment may have enough pipeline by value but too little late-stage coverage. A renewal forecast may look stable until contraction risk is distinguished from customer churn.A consumption forecast may appear ahead of plan because of one customer’s temporary usage spike. AI makes these conditions easier to inspect without turning the model into the authority.
Sales forecasting work typically falls into five practical types:
Data-heavy work: Opportunity records, stage histories, point-in-time snapshots, renewal schedules, usage records, quota data, and finance plans need to be reconciled before forecasting begins.
Evidence-heavy work: MEDDICC or MEDDPICC scorecards, mutual action plans, close plans, commercial approvals, and buyer-engagement summaries can be checked for missing or contradictory evidence.
Prediction-heavy work: Stage conversion, historical win rates, opportunity aging, seasonality, quarter linearity, renewal behavior, consumption curves, and close-date drift can support statistical and machine learning forecasts.
Judgment-heavy work: Commit calls, manager overrides, pull-in decisions, scenario assumptions, concentration risk, guidance alignment, and gap-to-plan actions require accountable human interpretation.
Workflow-heavy work: Weekly submissions, manager review, regional roll-up, finance reconciliation, executive forecast preparation, and post-quarter accuracy reviews benefit when AI assembles the next packet and preserves the decision trail.
The practical design rule is simple: AI should improve the evidence behind the forecast, show where assumptions differ, and prepare the next review. It should not silently redefine commit, override a manager submission, determine external guidance, or convert bookings expectations into recognized revenue without accountable review.
Why AI use cases in sales forecasting must be mapped at the sub-process level
“AI for sales forecasting” is not a single use case. Sales forecasting consists of multiple operational activities, each with a different objective, data, owner, and review process. One activity may determine whether an opportunity belongs in the commit forecast. Another may predict expected bookings from pipeline data. Others forecast renewals, consumption, or revenue for financial planning. Although these activities often use overlapping data, they answer different business questions and require different controls.
A better approach is to map AI use cases to the sales forecasting operating model:
- Function: A governed forecasting domain with a defined responsibility, such as deal-level inspection or finance reconciliation.
- Process: A recurring workflow inside the function, such as commit-deal inspection or forecast submission.
- Sub-process: A specific activity with a defined source artifact, calculation, output, and reviewer, such as detecting close-date drift across commit opportunities.
- AI-enabled opportunity: A specific AI capability applied to the artifacts used in that sub-process, such as predicting close-date movement using historical stage age, push history, remaining milestones, and segment behavior.
This distinction also protects forecast integrity.
Build AI-powered lease accounting and administration workflows
Streamline lease abstraction, accounting analysis, rent validation, reconciliations and reporting with secure, governed AI workflows that integrate with enterprise systems and maintain human oversight.
Sales forecasting operating model and AI opportunity mapping across forecasting processes
The operating model below covers sales forecasting operations from forecast policy design through post-quarter accuracy analysis. Core artifacts include the weekly forecast submission worksheet, opportunity record and stage history, pipeline snapshot table, pipeline coverage report, and commit list. These are supported by deal-level evidence such as MEDDPICC scorecards, mutual action plans, and slipped-deals reports, along with the forecast roll-up hierarchy. Other key artifacts include the renewal waterfall, consumption run-rate extract, FP&A bookings plan, bookings-to-revenue bridge, board revenue slide, and forecast accuracy variance report.
Function 1: Forecast policy and taxonomy design
Defines forecasting measures, categories, reporting cadence, roll-up structures, and policies for consistent forecast management.
Forecast governance begins before any opportunity is inspected. Teams need common definitions for the forecast measure, category taxonomy, fiscal calendar, snapshot cutoff, roll-up hierarchy, and treatment of slips, pull-ins, renewals, and excluded opportunities.
A critical distinction is the forecast measure. One business may forecast bookings. Another may use annual recurring revenue or annual contract value. A consumption business may forecast billable usage. Finance may separately forecast recognized revenue. The operating model should make each measure explicit before models are compared.
Teams involved: The chief revenue officer, VP of sales, RevOps manager, sales operations analysts, FP&A manager, regional sales directors, and chief of staff to the CRO run this function.
What AI helps with: What AI helps with: Document intelligence and semantic analysis can compare forecast policies to identify conflicting definitions and taxonomy changes. Historical forecast analysis can assess category consistency across teams by comparing assignments with actual close, slip, and loss outcomes. Hierarchy validation can detect gaps, duplicate attribution, and inconsistencies in forecast roll-ups. AI can also compare planned snapshot schedules with actual submission patterns and flag forecast-category usage that deviates from established policy.
What humans continue to own: The chief revenue officer and revenue leadership define the official forecasting policy. The RevOps manager owns operational implementation. Finance defines the relationship between sales forecast measures and finance planning measures. AI analyzes and prepares recommendations but does not redefine the official forecast methodology.
| Process | Sub-process | Key AI-enabled opportunities |
|---|---|---|
| Forecast measure definition | Bookings, ARR, ACV, renewal, consumption, or revenue measure |
|
| Currency and value-basis standardization |
|
|
| Forecast category management | Forecast category assignment |
|
| Category movement review |
|
|
| Fiscal cadence management | Weekly forecast schedule and snapshot cutoff |
|
| Forecast snapshot management |
|
|
| Roll-up design | Representative, manager, region, segment, and enterprise hierarchy |
|
| Ownership-transfer handling |
|
|
| Forecast policy administration | Slip, push, pull-in, downgrade, and override rules |
|
Key artifacts: Forecast policy document, fiscal calendar, snapshot schedule, forecast category definitions, forecast roll-up hierarchy, forecast measure dictionary, manager override policy.
Systems involved: CRM system, forecast management workspace, identity and organization directory, data warehouse, FP&A planning system, policy repository.
Regulatory and control considerations: Forecast definition version control, access controls, snapshot integrity, documented manager adjustments, segregation between operating forecast and finance reporting where necessary, and privacy controls where seller-level performance data is analyzed.
Accountable roles: Chief revenue officer, VP of sales, RevOps manager, FP&A manager, regional sales director.
Highest-value opportunities:
Forecast category assignment: High leverage because forecast categories lose decision value when different teams apply them differently.
Bookings, ARR, ACV, renewal, consumption, or revenue measure: High leverage because incompatible measures should not be combined in the same forecast roll-up.
Representative, manager, region, segment, and enterprise hierarchy: High leverage because hierarchy defects can omit or double-count forecast value.
Example agentic workflow: Forecast policy and category calibration review
- The workflow begins when forecast policies are reviewed and prior-quarter point-in-time snapshots become available for forecast accuracy analysis.
- It compares category definitions, actual close outcomes, slip rates, and timing by segment and manager.
- It flags categories whose historical behavior materially differs from policy expectations.
- It prepares a calibration packet showing category usage, exceptions, and proposed policy questions.
- The RevOps manager and revenue leadership review the evidence and approve any taxonomy or process change before the next forecast cycle.
Function 2: Pipeline hygiene and data integrity
Turning the current pipeline into a trustworthy input for the forecast.
Pipeline hygiene for forecasting is narrower than general CRM administration. It focuses on records that materially affect the forecast: stale opportunities, invalid close dates, inconsistent stages, missing next steps, duplicate value, orphaned ownership, amount changes, and fields required by the forecasting policy.
Teams involved: The RevOps manager, sales operations analysts, first-line sales managers, regional sales directors, deal desk manager, and account executives support this function.
What AI helps with: Anomaly detection can identify stale opportunities and unusual field changes. Classification can distinguish likely data-quality defects from legitimate exceptions. Sequence analysis can examine stage history and close-date movement. Entity matching can identify duplicate opportunities.
What humans continue to own: Sellers own factual opportunity updates. First-line sales managers confirm whether close dates, stages, amounts, and forecast categories reflect the current deal. RevOps owns data-quality policy and exception handling.
| Process | Sub-process | Key AI-enabled opportunities |
|---|---|---|
| Stale opportunity review | No-activity opportunity review |
|
| Stage-aging review |
|
|
| Close-date integrity | Close-date validation |
|
| Past-due close-date review | Exception detection identifies open opportunities whose close date has already passed. | |
| Stage integrity | Stage and forecast-category consistency checking |
|
| Mandatory field control | Opportunity field validation |
|
| Material amount-change review |
|
|
| Duplicate and orphan cleanup | Duplicate opportunity detection |
|
| Snapshot population reconciliation |
|
Key artifacts: Opportunity record, stage history, field-change history, stale-opportunity report, duplicate-opportunity queue, snapshot data-quality report.
Systems involved: CRM system, data warehouse, identity directory, activity repository, forecasting data mart.
Regulatory and control considerations: Access to seller and customer data, field-change logging, point-in-time snapshot retention, privacy controls for communication-derived signals, and documented correction rules.
Accountable roles: First-line sales manager, RevOps manager, sales operations analyst, regional sales director.
Highest-value opportunities:
Close-date validation: High leverage because repeated pushes and unrealistic close dates directly distort period-level forecasts.
No-activity opportunity review: High leverage because inactive opportunities can inflate apparent pipeline coverage.
Duplicate opportunity detection: High leverage because duplicate or orphaned opportunities can overstate or misattribute forecast value.
Example agentic workflow: Forecast snapshot hygiene review
- The workflow starts when the weekly forecast snapshot window opens.
- It checks opportunity activity, next steps, close dates, stage age, forecast category, amount changes, and ownership.
- It groups exceptions into stale, pushed, missing-data, duplicate, and hierarchy categories.
- First-line sales managers receive review packets for their affected opportunities.
- Confirmed changes are recorded before snapshot lock, with unresolved exceptions retained in the forecast evidence.
Function 3: Deal-level inspection
Turning individual opportunity evidence into a reviewable forecast judgment.
Deal inspection tests whether the evidence behind a forecast category is consistent with the expected close outcome. For complex enterprise sales, this may include MEDDICC or MEDDPICC evidence, decision criteria, decision process, economic buyer access, champion strength, paper process, competition, mutual action plans, commercial approvals, and remaining close milestones.
Teams involved: First-line sales managers, regional sales directors, account executives, RevOps manager, deal desk manager, and the VP of sales run this function.
What AI helps with: Evidence extraction can assemble qualification signals from opportunity fields, call summaries, mutual action plans, and commercial records. Relationship analysis can identify single-threading. Temporal analysis can detect repeated pushes and milestone drift. AI can prepare inspection questions tied to missing evidence.
What humans continue to own: The seller owns the deal facts. The first-line sales manager owns the inspection judgment. Regional leadership owns escalations and forecast calls. AI may identify risk indicators but should not claim that a seller is misrepresenting a deal or infer intent from incomplete signals.
| Process | Sub-process | Key AI-enabled opportunities |
|---|---|---|
| Lead qualification review | MEDDICC/MEDDPICC evidence check |
|
| Qualification-evidence freshness checking |
|
|
| Stakeholder engagement assessment | Economic buyer, champion, and single-threading analysis |
|
| Stakeholder-engagement change |
|
|
| Close-plan review | Mutual action plan and milestone verification |
|
| Buyer-owned action review |
|
|
| Slip-pattern analysis | Pushed and slipped deal review |
|
| Commercial readiness assessment | Commercial readiness dependency assessment |
|
Key artifacts: Opportunity record, MEDDPICC scorecard, mutual action plan, close plan, stage history, slipped-deals report, commercial approval record, commit list.
Systems involved: CRM system, conversation evidence repository, document repository, data warehouse.
Regulatory and control considerations: Privacy and purpose limitation for communication data, access to commercially sensitive information, source traceability, and human review before risk labels affect official forecast treatment.
Accountable roles: Account executive, first-line sales manager, regional sales director, VP of sales, RevOps manager.
Highest-value opportunities:
MEDDICC/MEDDPICC evidence check: High leverage because commit and best-case judgments are stronger when qualification claims can be traced to current evidence.
Mutual action plan and milestone verification: High leverage because unresolved or overdue milestones often reveal timing risk earlier than the entered close date.
Pushed and slipped deal review: High leverage because repeated timing movement is an important forecasting signal.
Example agentic workflow: Commit deal inspection packet
- The workflow starts from the weekly commit list.
- It aggregates opportunity history, qualification evidence, relationship signals, mutual action plan milestones, and commercial dependencies.
- It flags single-threaded deals, overdue milestones, repeated pushes, and unsupported qualification fields.
- It prepares a deal-inspection packet with source evidence and scenario impact if the deal slips.
- The first-line sales manager and regional sales director confirm the official forecast treatment.
Function 4: Bottom-up roll-up and forecast submission
Turning seller and manager judgment into a locked, auditable forecast.
Bottom-up forecasting captures the seller’s call, first-line manager judgment, regional roll-up, segment view, and enterprise submission at a defined point in time. The operational requirement is not only the final number. Teams also need to know who changed it, why it changed, and what the previous forecast said.
Teams involved: Account executives, first-line sales managers, regional sales directors, VP of sales, RevOps manager, sales operations analysts, chief of staff to the CRO, and the chief revenue officer run this function.
What AI helps with: Submission validation can detect missing calls, inconsistent category totals, unexplained overrides, and outlier manager adjustments. Change analysis can summarize what moved since the last forecast. Natural-language generation can prepare manager and regional commentary from approved forecast evidence.
What humans continue to own: Sellers submit their opportunity calls. First-line sales managers exercise judgment on team roll-ups. Regional sales directors own regional submissions. The chief revenue officer owns the executive sales forecast.
| Process | Sub-process | Key AI-enabled opportunities |
|---|---|---|
| Representative submission | Opportunity and roll-up call submission |
|
| Missing submission review |
|
|
| Manager forecast adjustment | First-line manager judgment |
|
| Material override review |
|
|
| Regional roll-up | Region and segment aggregation |
|
| Cross-region consistency review |
|
|
| Forecast submission finalization | Weekly timestamp and snapshot lock |
|
| Snapshot lineage validation |
|
|
| Forecast change explanation | Week-over-week forecast movement summary |
|
| Forecast volatility review |
|
Key artifacts: Weekly forecast submission worksheet, seller submission, manager roll-up, regional forecast, forecast snapshot table, override note, submission timestamp.
Systems involved: CRM system, forecast workspace, data warehouse, identity directory, analytics environment.
Regulatory and control considerations: Version control, immutable snapshot history where required, role-based access, documented overrides, and consistent cutoffs for later accuracy measurement.
Accountable roles: Account executive, first-line sales manager, regional sales director, VP of sales, RevOps manager, chief revenue officer.
Highest-value opportunities:
Week-over-week forecast movement summary: High leverage because leaders need to understand what changed between forecast submissions, not only the latest number.
First-line manager judgment: High leverage because differences between seller and manager calls should remain visible and explainable.
Weekly timestamp and snapshot lock: High leverage because forecast accuracy cannot be measured reliably without preserving the actual point-in-time submission.
Example agentic workflow: Weekly forecast submission preparation
- The workflow starts from the weekly commit list.
- It validates seller calls and aggregates manager and regional roll-ups.
- It identifies missing submissions, large overrides, and material changes since the prior snapshot.
- It prepares the locked submission worksheet and change commentary.
- Authorized managers approve their submissions, after which the point-in-time snapshot and notes are retained for future variance analysis.
Function 5: Statistical and AI-based revenue prediction
Creating an independent prediction layer alongside human forecast judgment.
Statistical forecasting gives leadership a second perspective on expected outcomes. It may combine historical stage conversion, opportunity age, close-date movement, deal size, segment, seasonality, quarter linearity, renewal patterns, and other approved features.
The model forecast should not be treated as a replacement for the official human submission by default. Its value is in showing where human judgment and historical evidence agree or diverge.
Teams involved: The RevOps manager, sales operations analysts, analytics or data science teams, FP&A manager, regional sales directors, chief revenue officer, and CFO support this function.
What AI helps with: Models can estimate close probability, likely close period, expected value, and forecast ranges. Time-series models can establish seasonality and within-quarter baselines. Ensemble approaches can reconcile multiple predictive methods with submitted forecasts.
What humans continue to own: Revenue leadership decides how model output is used in the operating forecast. Finance owns its planning forecast. Model owners approve methodology and validation standards. AI does not automatically convert a probability estimate into a commit decision.
| Process | Sub-process | Key AI-enabled opportunities |
|---|---|---|
| Weighted pipeline forecasting | Probability-weighted forecast calculation |
|
| Stage-conversion calibration |
|
|
| Time-series forecasting | Seasonality and quarter-linearity modeling |
|
| In-quarter pacing analysis |
|
|
| Deal close prediction | Propensity-to-close modeling |
|
| Expected amount-at-close estimation |
|
|
| Close-date prediction | Expected close-period and drift estimation |
|
| Forecast-period transition risk analysis |
|
|
| Human and statistical forecast reconciliation | Forecast comparison |
|
| Statistical forecast model validation | Backtesting and calibration |
|
| Model-drift monitoring | Model monitoring tracks changes in input distributions, conversion patterns, and model accuracy. |
Key artifacts: Pipeline snapshot table, model feature set, weighted pipeline forecast, model forecast, probability score, expected close-period estimate, human-model reconciliation report, model validation report.
Systems involved: CRM data store, forecast data mart, analytics environment, model registry, FP&A planning system.
Regulatory and control considerations: Model versioning, time-consistent training data, prevention of look-ahead leakage, explainability appropriate to the use case, access control, and documented human disposition of material model-human differences.
Accountable roles: RevOps manager, analytics lead, FP&A manager, regional sales director, chief revenue officer, CFO.
Highest-value opportunities:
Expected close-period and drift estimation: High leverage because a deal can ultimately win while still missing the period in which it was forecast.
Forecast comparison: High leverage because disagreement between human judgment and model evidence creates a useful review signal.
Backtesting and calibration: High leverage because model quality must be tested using the information that actually existed at each historical forecast date.
Example agentic workflow: Human-model forecast reconciliation
- The workflow starts when the weekly forecast snapshot is locked.
- It runs the approved statistical models using only data available at that cutoff.
- It compares model expected value and timing with submitted seller, manager, and regional forecasts.
- It prepares a reconciliation packet showing the largest divergences and their source features.
- RevOps and sales leadership review the differences and decide whether any official forecast judgment should change.
Accelerate AI Solutions Development
Build fully functional solutions from your high-value use cases, based on specific operational needs and enterprise context.
Function 6: Risk review and scenario analysis
Turning forecast uncertainty into specific downside, upside, and concentration scenarios.
Risk review asks a different question from prediction. Instead of producing one expected number, it tests how the forecast changes when defined assumptions move.
This includes pipeline coverage, large-deal concentration, deal slips, category downgrades, potential pull-ins, and systematic forecast bias. Terms such as “sandbagging” and “happy ears” may appear in sales organizations, but AI should treat them as possible under-forecasting or over-forecasting patterns, not as conclusions about a person’s intent.
Teams involved: The RevOps manager, regional sales directors, first-line sales managers, VP of sales, FP&A manager, chief of staff to the CRO, and chief revenue officer run this function.
What AI helps with: Scenario analysis can quantify the effect of slipping or downgrading selected deals. Coverage analytics can show risk by segment and horizon. Concentration analysis can identify excessive dependence on a few transactions. Historical bias analysis can identify persistent over- or under-forecasting patterns.
What humans continue to own: Sales leaders decide whether deals remain in commit, move to upside, or are escalated. RevOps owns scenario methodology. The chief revenue officer owns the operating forecast judgment.
| Process | Sub-process | Key AI-enabled opportunities |
|---|---|---|
| Pipeline coverage review | Pipeline coverage assessment |
|
| Coverage-quality analysis | Risk-based prioritization adjusts the review for stale opportunities, stage age, close-date risk, and evidence quality. | |
| Forecast concentration assessment | Top-deal dependency |
|
| Account and segment concentration |
|
|
| Scenario modeling | Scenario definition |
|
| Probabilistic forecast estimation |
|
|
| Forecast-bias review | Forecast bias pattern analysis |
|
| Risk packet preparation | Weekly forecast risk review | Multi-source aggregation combines coverage, concentration, deal evidence, scenario results, and forecast changes into one review packet. |
Key artifacts: Pipeline coverage report, commit list, scenario table, concentration report, slipped-deals report, forecast-bias report, weekly risk review packet.
Systems involved: CRM data store, forecast data mart, analytics environment, quota repository, FP&A plan source.
Regulatory and control considerations: Consistent scenario assumptions, documented thresholds, human review of seller-level risk labels, privacy controls, and retention of override rationale where forecasts support broader reporting controls.
Accountable roles: RevOps manager, first-line sales manager, regional sales director, VP of sales, chief revenue officer, FP&A manager.
Highest-value opportunities:
Top-deal dependency: High leverage because a forecast can appear healthy in aggregate while depending on a small number of binary outcomes.
Scenario definition: High leverage because leadership can quantify specific downside and upside scenarios before changing the official call.
Forecast bias pattern analysis: High leverage because directional error helps identify forecast calibration issues that absolute error alone cannot show.
Example agentic workflow: Weekly forecast risk review
- The workflow starts from the locked weekly forecast submission and point-in-time pipeline snapshot.
- It aggregates opportunity stage history, close plans, engagement summaries, prior snapshots, quota, and FP&A plan.
- It retrieves the approved forecast policy and segment-specific coverage thresholds.
- It prepares a risk packet showing weak commit evidence, repeated close-date drift, regional coverage gaps, top-deal concentration, and base/slip/downgrade scenarios.
- The RevOps manager reviews the packet. The regional sales director confirms or overrides the recommended treatment with a judgment note, and material issues move to the CRO forecast review.
- Approved adjustments, override notes, and timestamps are retained with the forecast snapshot.
Function 7: Renewals and expansion forecasting
Turning the recurring-revenue base into a cohort-based view of retention, contraction, and expansion.
Renewal forecasting differs from new-logo forecasting. The starting population is known, but the value at risk changes through churn, contraction, renewal, price movement, and expansion.
A useful renewal waterfall separates the opening renewable base into renewed, expected renewal, churn risk, contraction, and unresolved populations. Expansion should be tracked separately where necessary, so teams do not count the same commercial outcome in both the renewal and expansion forecast.
Teams involved: The VP of customer success, customer success leaders, account management leaders, RevOps manager, sales operations analysts, FP&A manager, regional sales directors, and chief revenue officer support this function.
What AI helps with: Cohort analytics can forecast renewal behavior by contract timing, account segment, product mix, adoption signals, prior expansion, support history, and commercial evidence. AI can also identify contraction risk and expansion opportunities without merging them into a single opaque score.
What humans continue to own: Customer and revenue leaders own the commercial renewal judgment. FP&A owns planning assumptions. Account owners confirm customer context that may not be visible in behavioral data.
| Process | Sub-process | Key AI-enabled opportunities |
|---|---|---|
| Renewal cohort management | Renewal population identification |
|
| Renewal-date validation |
|
|
| Churn-risk assessment | Logo and value churn assessment |
|
| Renewal-timing risk analysis |
|
|
| Contraction forecasting | Downsell and seat reduction |
|
| Usage-led contraction review | Trend analysis identifies sustained reductions in product usage that may support commercial review. | |
| Retention forecasting | GRR and NRR forecasting |
|
| Retention scenario analysis |
|
|
| Expansion opportunity assessment | Renewal-linked expansion identification |
|
| Expansion double-count control |
|
Key artifacts: Renewal waterfall, contract renewal schedule, recurring-revenue base, churn-risk record, contraction estimate, expansion pipeline, GRR/NRR forecast.
Systems involved: Contract repository, customer account system, subscription or entitlement records, product usage repository, forecast data mart, FP&A planning system.
Regulatory and control considerations: Contract data access, privacy controls for customer usage and communication data, consistent recurring-revenue definitions, and documented treatment of renewal and expansion double counting.
Accountable roles: VP of customer success, account leader, RevOps manager, FP&A manager, regional sales director, chief revenue officer.
Highest-value opportunities:
Renewal population identification: High leverage because every renewal forecast depends on having a complete and correctly timed starting cohort.
Downsell and seat reduction: High leverage because logo retention can remain high while recurring value contracts materially.
Renewal-linked expansion identification: High leverage because renewal and expansion need to be connected without double-counting incremental value.
Example agentic workflow: Renewal cohort risk packet
- The workflow begins with the upcoming-quarter renewal cohort.
- It reconciles contract dates, recurring value, account ownership, usage trends, renewal opportunities, and attached expansion.
- It identifies unresolved renewal records, churn-risk accounts, contraction signals, and double-count candidates.
- It prepares a cohort waterfall and account-level review packet.
- Customer and revenue leaders confirm renewal assumptions before the forecast rolls into the enterprise view.
Function 8: Consumption and usage-based revenue forecasting
Turning product consumption into a forward view of billable usage and commercial value.
Usage-based forecasting introduces a different risk profile. The opportunity may already be contracted, but realized commercial value depends on how customers consume.
Forecasting therefore needs to distinguish raw product telemetry from billable usage, contractual commitments from actual drawdown, overages from included units, and operating consumption forecasts from recognized-revenue treatment.
Teams involved: The RevOps manager, sales operations analysts, usage data teams, account management teams, FP&A manager, revenue accounting teams, CFO, and chief revenue officer support this function.
What AI helps with: Time-series models can project run rate and seasonality. Cohort models can compare new and mature customers. Commitment analysis can estimate depletion timing and potential overages. Anomaly detection can separate genuine consumption changes from telemetry or aggregation defects.
What humans continue to own: Commercial leaders interpret account-specific behavior. Finance teams owns plan treatment. Revenue accounting teams owns recognized-revenue treatment under the applicable accounting framework.
| Process | Sub-process | Key AI-enabled opportunities |
|---|---|---|
| Usage data readiness assessment | Billable usage vs raw telemetry validation |
|
| Meter and unit consistency review |
|
|
| Run-rate forecasting | Near-term consumption forecasting |
|
| Usage anomaly adjustment |
|
|
| Commitment tracking | Contracted commitment drawdown |
|
| Commitment-to-usage variance analysis |
|
|
| Overage forecasting | Over-consumption assessment |
|
| Overage-timing prediction | Predictive forecasting estimates when threshold crossing is likely within the forecast horizon. | |
| Cohort modeling | Consumption cohort analysis |
|
Key artifacts: Customer product usage telemetry extract, billable usage record, consumption run-rate dashboard extract, commitment schedule, drawdown report, overage estimate, cohort consumption curve.
Systems involved: Product telemetry repository, metering layer, contract repository, billing data store, data warehouse, FP&A planning system, revenue accounting environment.
Regulatory and control considerations: Data integrity between telemetry and billable usage, privacy and security of usage data, model treatment of anomalous events, contract-price alignment, and ASC 606 or IFRS 15 review when forecasts feed recognized-revenue expectations.
Accountable roles: RevOps manager, FP&A manager, revenue accounting manager, CFO, usage data owner, chief revenue officer.
Highest-value opportunities:
Billable usage vs raw telemetry validation: High leverage because the forecast should be based on the commercial usage measure rather than unvalidated raw activity.
Contracted commitment drawdown: High leverage because it identifies both potential overage and under-consumption exposure.
Consumption cohort analysis: High leverage because newly activated and mature accounts often follow materially different usage patterns.
Example agentic workflow: Consumption run-rate review
- The workflow starts from the latest approved consumption extract.
- It reconciles billable usage, commitment balances, customer cohorts, and contract pricing boundaries.
- It projects base consumption, potential overage, and downside cases.
- It flags material changes driven by one-time spikes, meter anomalies, or account-specific events.
- FP&A and revenue accounting review the forecast treatment before it is included in finance reporting.
Function 9: Finance reconciliation and guidance alignment
Connecting the commercial forecast with the finance plan and recognized-revenue view.
This is one of the most important boundaries in the operating model.
Sales forecasts often describe expected bookings or recurring value. Financial statements recognize revenue under accounting rules. A signed transaction may produce immediate bookings but revenue over time. Usage-based consideration may vary with actual consumption. Foreign exchange, start dates, service periods, contract modifications, cancellations, and performance obligations can all affect the bridge.
ASC 606 and IFRS 15 govern revenue recognition from customer contracts. Neither standard says that a sales “commit” forecast becomes recognized revenue when the deal closes.
Teams involved: The FP&A manager, CFO, revenue accounting manager, RevOps manager, chief revenue officer, sales operations analysts, and finance leadership run this function.
What AI helps with: AI can reconcile the sales forecast with the annual operating plan, build bookings-to-revenue bridges, identify assumption mismatches, compare backlog and deferred revenue records, and prepare sensitivity scenarios.
What humans continue to own: FP&A owns the planning forecast. Revenue accounting owns accounting conclusions. The CFO and authorized executives own external financial guidance. Sales leadership owns the operating sales forecast.
| Process | Sub-process | Key AI-enabled opportunities |
|---|---|---|
| Forecast-to-plan reconciliation | Forecast vs operating plan bridge |
|
| Variance-driver analysis |
|
|
| Bookings-to-revenue bridge | Commercial close to expected revenue timing |
|
| Revenue-timing exception review | Anomaly detection identifies transactions with unusual ramp, implementation, usage, or contractual timing. | |
| Deferred revenue and backlog checks | Existing contracted base validation |
|
| Forecast assumption alignment | Forecast assumption management |
|
| Sales-to-finance definition alignment | Semantic analysis identifies differences in bookings, recurring value, backlog, consumption, and revenue definitions. | |
| Guidance sensitivity analysis | Internal guidance corridor and scenario review |
|
Key artifacts: FP&A bookings plan, operating plan, bookings-to-revenue bridge, revenue forecast, deferred revenue schedule, backlog record, assumption log, guidance scenario packet.
Systems involved: Forecast data mart, FP&A planning system, contract repository, revenue accounting system, general ledger environment, data warehouse.
Regulatory and control considerations: SOX Section 302/404 and internal control over financial reporting can become relevant when forecasting data or assumptions feed financial reporting or disclosure controls [1]. The SEC defines ICFR around reasonable assurance over reliable financial reporting. COSO provides a widely used internal-control framework spanning operations, reporting, and compliance objectives.
For public companies, Regulation FD becomes relevant when material nonpublic information, including certain forecast or guidance information, is communicated externally. Regulation FD governs selective disclosure, not the internal mechanics of the forecast model. The statutory safe harbor for certain forward-looking statements is also a disclosure-law consideration, not a sales forecasting methodology.
Accountable roles: FP&A manager, revenue accounting manager, CFO, RevOps manager, chief revenue officer.
Highest-value opportunities:
Commercial close to expected revenue timing: High leverage because a forecasted booking does not necessarily produce equivalent recognized revenue in the same period.
Forecast vs operating plan bridge: High leverage because leaders need to understand whether the gap comes from volume, timing, renewal, consumption, or finance assumptions.
Forecast assumption management: High leverage because sales and finance forecasts can diverge even when they begin with the same commercial population.
Example agentic workflow: Sales-to-finance forecast reconciliation
- The workflow starts after the sales forecast snapshot is approved.
- It reconciles new bookings, renewals, expansions, consumption assumptions, contract timing, and the FP&A plan.
- It builds a bridge between the sales submission and the finance outlook.
- It flags material differences in timing, FX, recurring-value treatment, consumption, and revenue-recognition assumptions.
- FP&A and revenue accounting review the differences, while the CFO retains responsibility for the finance outlook and external guidance decisions.
Function 10: Executive forecast review
Turning detailed forecast evidence into an executive decision packet.
Executive forecast review compresses thousands of pipeline records into the few issues leadership must decide: current call, change since prior forecast, gap to plan, commit risk, concentration, upside, renewal exposure, consumption movement, and actions required before the next review.
Teams involved: The chief revenue officer, CFO, VP of sales, regional sales directors, RevOps manager, FP&A manager, chief of staff to the CRO, and executive leadership participate in this function.
What AI helps with: AI can summarize material changes, prepare the forecast call packet, identify the deals or cohorts driving variance, generate scenario tables, and assemble board or earnings-supporting draft material from approved data.
What humans continue to own: The chief revenue officer owns the sales forecast call. The CFO owns finance outlook decisions. Authorized executives, finance, legal, and investor relations roles own external guidance and disclosures.
| Process | Sub-process | Key AI-enabled opportunities |
|---|---|---|
| CRO forecast preparation | Weekly executive forecast packet preparation |
|
| Executive deal review prioritization | Risk-based prioritization ranks deals requiring discussion based on value, forecast category, evidence gaps, close date push history, and scenario impact. | |
| Gap-to-plan review | Remaining gap decomposition |
|
| Gap-risk scenario review |
|
|
| In-quarter reforecast | Material-change trigger detection |
|
| Reforecast bridge preparation |
|
|
| Board reporting | Revenue and bookings slide preparation |
|
| External guidance support | Evidence packet for authorized reviewers |
|
Key artifacts: CRO forecast packet, gap-to-plan action plan, scenario table, board revenue slide, executive forecast commentary, guidance-support packet.
Systems involved: Forecast data mart, analytics environment, FP&A planning system, board reporting repository, finance reporting environment.
Regulatory and control considerations: Disclosure controls, confidentiality of material nonpublic information, Regulation FD for selective disclosure, applicable forward-looking-statement requirements, SOX-related controls where the forecast supports financial reporting, and role-based approval for executive communications.
Accountable roles: Chief revenue officer, CFO, VP of sales, FP&A manager, RevOps manager, authorized disclosure owners.
Highest-value opportunities:
Weekly executive forecast packet preparation: High leverage because executives need a concise explanation of the current call and what materially changed.
Remaining gap decomposition: High leverage because it shows what portion of the target depends on commit, upside, renewals, consumption, or unresolved assumptions.
Revenue and bookings slide preparation: High leverage because executive reporting can be assembled from approved data while final narrative and disclosure decisions remain with accountable leaders.
Example agentic workflow: CRO forecast call preparation
- The workflow starts after regional forecast submissions are locked.
- It aggregates the sales roll-up, model forecast, finance plan, renewal outlook, consumption forecast, and prior executive call.
- It prepares a change bridge, commit-risk list, concentration view, gap-to-plan analysis, and scenario table.
- The RevOps manager validates the packet and resolves data exceptions.
- The chief revenue officer and CFO make their respective sales and finance judgments, with any external communication following established disclosure controls.
Function 11: Forecast accuracy analytics and post-mortem
Turning forecast history into calibration evidence for the next cycle.
Forecast accuracy should be measured from point-in-time submissions, not reconstructed after the quarter closes. Teams need to know what the forecast said at comparable horizons, such as quarter start, mid-quarter, four weeks before close, and final call.
Absolute error shows forecast magnitude error. Signed error shows direction of bias. Category conversion reveals whether commit, best case, or other categories are calibrated. Slip analysis explains timing failure. Model calibration shows whether predicted probabilities correspond to observed outcomes.
Teams involved: The RevOps manager, sales operations analysts, regional sales directors, first-line sales managers, FP&A manager, analytics teams, chief revenue officer, and VP of sales use this function.
What AI helps with: AI can decompose forecast error, identify recurring slip patterns, compare managers and segments on a like-for-like basis, analyze category calibration, and prepare coaching evidence. Model-monitoring routines can also identify performance drift.
What humans continue to own: RevOps defines the measurement methodology. Sales leadership interprets manager and segment performance. Coaching remains a management responsibility. Model owners decide when models need recalibration or retraining.
| Process | Sub-process | Key AI-enabled opportunities |
|---|---|---|
| Forecast-vs-actual measurement | Forecast horizon accuracy analysis | Accuracy analysis compares each locked forecast vintage with actual outcomes. |
| Absolute and signed error analysis |
|
|
| Variance decomposition | Forecast movement analysis |
|
| Late-add and pull-in analysis |
|
|
| Category calibration | Commit, best case, and pipeline conversion |
|
| Category-aging review |
|
|
| Manager and segment calibration | Systematic bias analysis |
|
| Forecast-volatility analysis |
|
|
| Model monitoring | Prediction calibration and drift |
|
| Coaching feedback | Forecast behavior review |
|
Key artifacts: Forecast accuracy variance report, point-in-time snapshot history, slip analysis, category calibration report, manager bias report, model validation report, forecast coaching packet.
Systems involved: Forecast data warehouse, CRM snapshot store, analytics environment, model registry, FP&A actuals source.
Regulatory and control considerations: Historical snapshot retention, consistent metric definitions, restricted access to employee performance data, privacy and fairness review, model monitoring, and documented methodology changes.
Accountable roles: RevOps manager, sales operations analyst, regional sales director, FP&A manager, analytics lead, chief revenue officer.
Highest-value opportunities:
Forecast horizon accuracy analysis: High leverage because forecast quality needs to be measured from the actual point-in-time submission at comparable forecast vintages.
Forecast movement analysis: High leverage because different causes of forecast error require different operational responses.
Commit, best case, and pipeline conversion: High leverage because forecast categories only remain useful when their historical outcomes are understood and recalibrated.
Example agentic workflow: Quarterly forecast calibration review
- The workflow starts after quarter-end actuals are available.
- It retrieves locked weekly snapshots, submitted forecasts, actual closes, slips, losses, amount changes, and category history.
- It decomposes error by manager, region, segment, category, and forecast horizon.
- It prepares category-calibration, bias, slip, and model-performance findings.
- RevOps and sales leadership review the evidence and decide which forecasting policies, coaching practices, or model assumptions should change for the next quarter.
Accelerate AI Solutions Development
Build fully functional solutions from your high-value use cases, based on specific operational needs and enterprise context.
High-value AI use cases in sales forecasting
High-value AI use cases in sales forecasting focus on improving the reliability of forecast inputs, identifying deal-level risks, predicting commercial outcomes, and strengthening forecast reviews. By analyzing pipeline data, historical performance, deal evidence, renewal trends, and consumption patterns, AI helps revenue teams identify potential forecast gaps, assess uncertainty, and prepare more informed forecasts while keeping final commercial and financial decisions with accountable teams.
| Use case | Function | How AI creates high-value impact |
|---|---|---|
| Forecast category assignment | Forecast policy and taxonomy design | Historical calibration compares forecast-category assignments with actual close, slip, and loss outcomes, helping RevOps identify inconsistent category use and policy drift across teams. |
| Close-date validation | Pipeline hygiene and data integrity | Change-history analysis, milestone checks, and anomaly detection identify repeated pushes, unrealistic close dates, past-due opportunities, and unusual period-end clustering before the forecast snapshot is locked. |
| MEDDICC/MEDDPICC evidence check | Deal-level inspection | Evidence extraction, completeness scoring, and contradiction detection assess whether qualification fields are supported by current deal evidence before managers confirm commit or best-case treatment. |
| Week-over-week forecast movement summary | Bottom-up roll-up and forecast submission | AI explains movement from the prior forecast through wins, losses, slips, pull-ins, new opportunities, amount changes, category changes, and manager adjustments, giving leaders a traceable view of what changed. |
| Expected close-period and drift estimation | Statistical and AI-based revenue prediction | Time-to-event modeling and historical deal patterns estimate whether opportunities are likely to close in the current period or move later, providing an independent timing view for comparison with submitted close dates. |
| Scenario definition | Risk review and scenario analysis | Scenario modeling recalculates the forecast under defined deal slips, category downgrades, losses, and pull-ins so leadership can quantify specific downside and upside cases before changing the official call. |
| Renewal population identification | Renewals and expansion forecasting | Entity resolution and completeness checks establish the full renewal cohort by period, linking contracts, recurring value, renewal dates, and ownership so churn, contraction, retention, and expansion forecasts start from a reliable base. |
| Near-term consumption forecasting | Consumption and usage-based revenue forecasting | Time-series models project billable consumption using current run rate, trend, seasonality, and account-level behavior while identifying the customers and usage changes driving movement from the prior forecast. |
| Forecast vs operating plan bridge | Finance reconciliation and guidance alignment | Variance analysis reconciles the commercial forecast with the operating plan and decomposes differences across new business, renewals, expansion, consumption, timing, FX, and other approved assumptions. |
| Weekly executive forecast packet preparation | Executive forecast review | AI combines the current call, prior call, actuals to date, gap to plan, coverage, concentration, material deal risk, and forecast movement into decision-ready evidence for executive review. |
| Forecast horizon accuracy analysis | Forecast accuracy analytics and post-mortem | AI compares locked point-in-time forecast snapshots with actual outcomes at consistent forecast vintages, showing how accuracy changes from early-quarter forecasts through the final call across managers, regions, segments, and selling motions. |
A use case earns high-value status when it affects recurring forecast decisions, uses reliable point-in-time artifacts, reduces manual inspection effort, exposes material uncertainty earlier, or strengthens the evidence behind executive and finance review.
How agentic AI works in sales forecasting workflows
Agentic AI in sales forecasting works best as a governed sequence that maintains context across multiple forecast activities. It can retrieve records, inspect evidence, run approved models, prepare scenarios, compare human and statistical forecasts, and create the next review packet.
It should pause before an official forecast adjustment, finance treatment, executive guidance decision, or external disclosure.
Example 1: Weekly forecast risk review
Agent role: Prepare the regional forecast risk packet before the executive forecast call.
Trigger artifact: The locked weekly forecast submission.
Aggregate: The workflow retrieves point-in-time opportunity records, stage history, MEDDICC/MEDDPICC evidence, mutual action plans, recent engagement summaries, prior snapshots, quota, coverage metrics, and the FP&A plan.
Retrieve policy: It retrieves forecast-category definitions, commit evidence requirements, manager override rules, and segment-specific coverage thresholds.
Prepare decision packet: It applies MEDDICC/MEDDPICC evidence check, pushed and slipped deal review, economic buyer, champion, and single-threading analysis, pipeline coverage vs quota or target, top-deal dependency, and slip, downgrade, loss, and pull-in cases to prepare the regional risk view.
Human checkpoint: The RevOps manager validates the packet. The regional sales director confirms the official forecast treatment, records an override rationale where appropriate, and escalates material deals to the CRO forecast call.
Handoff and audit evidence: Approved adjustments, judgment notes, model outputs, source snapshots, and timestamps are retained with the forecast submission.
Example 2: Renewal and expansion forecast workflow
Agent role: Prepare the next-quarter renewal forecast.
Trigger artifact: The set of contracts and recurring revenue scheduled for renewal during the forecast period.
Aggregate: The workflow retrieves contracted recurring value, renewal dates, renewal opportunity records, product adoption signals, account health evidence, contraction indicators, and attached expansion opportunities.
Retrieve policy: It retrieves renewal forecast definitions, GRR/NRR methodology, churn treatment, contraction rules, and expansion double-count policy.
Prepare decision packet: It establishes the renewable base by period, evaluates logo and value churn assessment and downsell and seat reduction, calculates the GRR and NRR forecast, and separates base renewal value from the renewal-linked expansion pipeline.
Human checkpoint: Customer success and account leaders review individual account assumptions. The RevOps manager confirms the roll-up methodology.
Handoff and audit evidence: The approved renewal forecast feeds the overall revenue forecast with account-level assumptions retained.
Example 3: Consumption forecast workflow
Agent role: Prepare a usage-based commercial forecast for the next reporting period.
Trigger artifact: The latest approved billable-consumption extract.
Aggregate: The workflow retrieves usage history, contract commitments, current drawdown, pricing boundaries, customer cohorts, recent anomalies, and finance plan assumptions.
Retrieve policy: It retrieves billable-usage definitions, commitment treatment, overage rules, and finance reconciliation requirements.
Prepare decision packet: It performs billable usage vs raw telemetry validation, generates the near-term consumption extrapolation, projects contracted commitment drawdown, evaluates usage above committed levels, and compares material accounts against consumption curves by account cohort.
Human checkpoint: The usage data owner validates data integrity, FP&A confirms planning treatment, and revenue accounting reviews any recognized-revenue implications.
Handoff and audit evidence: Approved assumptions move into the finance reconciliation workflow with source data and judgment notes retained.
Example 4: Forecast vs operating plan bridge workflow
Agent role: Explain the difference between the sales forecast and the finance revenue outlook.
Trigger artifact: The approved weekly sales forecast and latest FP&A forecast.
Aggregate: The workflow retrieves bookings expectations, renewal forecast, consumption forecast, contract timing, revenue schedules, deferred revenue data, FX assumptions, and operating plan values.
Retrieve policy: It retrieves the finance definitions governing bookings, recurring value, recognized revenue, and forecast assumptions.
Prepare decision packet: It prepares the forecast vs operating plan bridge, evaluates commercial close to expected revenue timing, validates the existing contracted base, and surfaces differences in FX, ramp, cancellation, consumption, and timing assumptions.
Human checkpoint: The FP&A manager and revenue accounting manager review finance treatment. The chief revenue officer confirms commercial assumptions. The CFO owns the final finance view.
Handoff and audit evidence: Approved assumptions and unresolved differences are retained with the finance forecast.
The review boundary is the control property. An agent may carry forecasting context across many steps, but accountable people retain the official forecast call, accounting judgment, guidance decision, and exception disposition.
How to prioritize AI use cases in sales forecasting
Revenue leaders should prioritize AI use cases by forecast value, data readiness, point-in-time evidence quality, model feasibility, review clarity, and control risk.
| Criterion | What to ask |
|---|---|
| Forecast materiality | Does the sub-process influence a meaningful part of bookings, recurring revenue, consumption, or the executive forecast? |
| Snapshot readiness | Can the organization reproduce what was known at each historical forecast cutoff? |
| Artifact availability | Are opportunity histories, forecast submissions, close plans, renewal records, usage data, and finance assumptions accessible and sufficiently complete? |
| Outcome labels | Are historical wins, losses, slips, renewal outcomes, and actual amounts reliable enough for model development and testing? |
| Review boundary | Can a named role confirm the output before the official sales or finance forecast changes? |
| Model stability | Does the process have enough history within comparable segments, products, and selling motions for useful statistical patterns? |
| Blast radius | If the model is wrong, is the first effect a review flag or recommendation rather than an automatic guidance or accounting change? |
| Business impact | Can the organization measure improvement through forecast error, slip rate, inspection effort, forecast-cycle time, or gap detection? |
Four failure patterns should be avoided.
Reconstructing history from current records: Current opportunity values do not show what the team knew eight weeks earlier. Point-in-time snapshots are required.
Training on future information: A model should not use close-lost reasons, final contract terms, or later-stage fields that did not exist at the historical forecast date.
Treating one model as universal: Enterprise, transactional, renewal, and consumption motions often need different features, horizons, and calibration.
Allowing model output to erase judgment: The goal is to make management judgment more evidence-based and inspectable, not to hide it behind an algorithm.
Strong starting points include close-date drift detection, commit-deal evidence checks, weekly forecast change decomposition, renewal waterfall preparation, forecast risk scenarios, and snapshot-based accuracy analytics.
Governance, risk, and responsible AI in sales forecasting
Sales forecasting affects revenue expectations, management decisions, investor communications, employee performance discussions, customer data, and financial planning. Governance should therefore define which outputs are informational, which are recommendations, and which require explicit human approval.
Human-in-the-loop oversight: AI may identify stale opportunities, estimate close probability, generate scenario forecasts, rank deal risk, prepare renewal waterfalls, project consumption, and draft forecast commentary. Account executives, first-line sales managers, regional sales directors, the RevOps manager, FP&A manager, revenue accounting manager, chief revenue officer, and CFO retain the relevant commercial and financial decisions.
Forecast and model integrity: Historical training and testing should use point-in-time snapshots. Organizations should prevent look-ahead leakage, document feature definitions, measure performance by segment and horizon, monitor drift, and retain model versions. A model that performs well one week before quarter close may not be appropriate for a thirteen-week forecast horizon.
Bias and interpretation: Seller or manager forecasts should not be labeled as sandbagging, optimism, or manipulation solely because they differ from a model. Use signed error, category calibration, override history, and forecast evidence to identify patterns for review while keeping performance conclusions with management.
Regulatory and standards alignment: The NIST AI Risk Management Framework provides a voluntary framework for managing AI risk and is currently undergoing revision, so governance programs should track its evolution rather than treating version 1.0 as static. COSO provides an internal-control framework that can support governance over information, reporting, and control activities.
Where sales forecasting data feeds financial reporting, accounting estimates, or disclosure processes, organizations should distinguish the applicable requirements carefully. ASC 606 and IFRS 15 govern revenue recognition. SOX-related controls address financial reporting and disclosure controls. PCAOB AS 2501 addresses auditors’ work over accounting estimates where such estimates are material to financial statements; it is not a sales forecasting standard.
Privacy and data minimization: Opportunity records, email engagement, call summaries, contact relationships, seller behavior, and customer usage may contain personal data. The CCPA also provides rights relating to personal information for covered California consumers and has been amended through the CPRA. Forecasting workflows should therefore avoid collecting communication or behavioral data simply because it is technically available.
Security and access: Forecasts can contain commercially sensitive customer, pricing, renewal, and guidance information. ISO/IEC 27001:2022 defines requirements for an information security management system, while the AICPA Trust Services Criteria address controls relating to security, availability, processing integrity, confidentiality, and privacy. Least-privilege access, field-level controls, scoped data retrieval, and audit logging should apply throughout the workflow.
Traceability: Retain the source snapshot, model version, forecast policy version, scenario assumptions, generated recommendation, human override, approval, and final submitted value. For forecast-critical workflows, the organization should be able to answer what the model knew at the time, why it produced the output, who reviewed it, and what changed afterward.
Accelerate AI Solutions Development
Build fully functional solutions from your high-value use cases, based on specific operational needs and enterprise context.
How ZBrain operationalizes AI use cases in sales forecasting
Identifying high-value use cases is only the first step in sales forecasting. Revenue teams need a controlled way to design, build, validate, deploy, govern, and scale AI workflows across pipeline inspection, forecast submission, revenue prediction, risk review, renewal and consumption forecasting, finance reconciliation, executive review, and forecast accuracy analysis.
This is where ZBrain helps.
ZBrain is an end-to-end agentic AI orchestration platform that supports this lifecycle through four connected stages: ZBrain Analyzer, ZBrain Design, ZBrain Solution Builder, and ZBrain Governance. The platform provides a governed path from use-case analysis to deployed agentic workflows while maintaining policies, permissions, approval points, monitoring, and runtime evidence.
ZBrain Analyzer
ZBrain Analyzer helps teams examine selected sales forecasting processes and document the business context, systems, data, artifacts, roles, controls, metrics, and review requirements needed to evaluate each use case. It gathers inputs from functional team members across the relevant commercial, operations, finance, and analytics functions.
ZBrain Design
ZBrain Design creates a build-ready technical design for the selected sales forecasting use case. It defines the business requirements, functional requirements, user journeys, architecture, workflow logic, data specifications, integration context, approval points, exception paths, and governance considerations needed before development begins.
ZBrain Solution Builder
ZBrain Solution Builder enables teams to create, configure, and validate governed AI workflows for sales forecasting based on the approved technical design. It supports testing across routine, exception, model, data-quality, forecast-review, and control-sensitive scenarios before deployment.
ZBrain Governance
ZBrain Governance applies policies, access controls, human approval requirements, monitoring, escalation controls, and traceability throughout workflow execution. Agents can be registered with their purpose, owner, approved models, data scope, allowed actions, review requirements, and lifecycle status, helping organizations maintain oversight of AI outputs, reviewer actions, exceptions, and authorized system updates.
Future of AI in sales forecasting
The future of sales forecasting will move away from a single weekly number toward a continuously reconciled forecast state.
The seller submission, manager judgment, statistical prediction, renewal outlook, usage forecast, and finance view will increasingly coexist as separate but connected signals. The value will come from understanding why they differ and what changed since the previous snapshot.
Agentic workflows will maintain this context across the forecasting cycle. A workflow may inspect a commit opportunity, identify close-date drift, calculate the quarter impact, update the risk packet, compare the change with the model forecast, and prepare the next executive review. It can carry the evidence across steps without becoming the authority that approves the forecast.
Forecasting will also become more horizon-aware. The best signal thirteen weeks before quarter end may differ from the best signal one week before close. Historical model performance, category calibration, and manager judgment should therefore be measured at consistent forecast vintages rather than reduced to one quarter-end accuracy score.
Renewal and consumption forecasting will become increasingly important as revenue models diversify. New-logo opportunity forecasting alone cannot explain businesses with large installed bases, contracted recurring revenue, variable consumption, or expansion-heavy growth.
Finance integration will also become more explicit. Commercial forecasts will remain distinct from accounting revenue, but the bridge between them will become more automated, inspectable, and continuously updated.
The differentiator will therefore not be the forecasting model alone. It will be the quality of the point-in-time data, the discipline of the forecast taxonomy, the strength of the review boundary, the model’s calibration, the clarity of the finance bridge, and the auditability of every material adjustment.
Endnote
Sales forecasting is not a single prediction problem.
It combines forecast policy, pipeline integrity, deal inspection, seller and manager judgment, statistical modeling, coverage, concentration, renewals, consumption, finance reconciliation, executive review, and post-quarter calibration.
AI can support this operating model by checking opportunity evidence, detecting stale and slipped deals, comparing human and model forecasts, forecasting close timing, modeling risk scenarios, building renewal waterfalls, projecting consumption, reconciling sales and finance views, and preparing executive forecast packets.
The implementation challenge is precision.
A broad project called “automate sales forecasting” does not define which forecast is being automated, which historical snapshot is valid, what outcome the model predicts, how its accuracy is measured, or who owns the final judgment.
A strong operating model keeps accountability with the roles that already own the decisions. Sellers own opportunity facts. First-line sales managers own deal inspection. Regional sales directors own regional forecast judgments. RevOps owns forecast process and methodology. Customer success leaders own renewal context. FP&A owns the planning forecast. Revenue accounting owns accounting treatment. The chief revenue officer owns the sales forecast. The CFO owns the finance outlook and related financial judgments.
Organizations should begin with a bounded sub-process, establish point-in-time baseline accuracy, validate routine and exception cases, compare AI output with human judgment, and expand only after the workflow demonstrates stable evidence quality, useful calibration, controlled access, and clear reviewer accountability.
Use ZBrain to analyze, design, build, and govern AI workflows across forecast inspection, prediction, risk analysis, finance reconciliation, and accuracy monitoring. Connect with us to learn more!
Author’s Bio


Akash's ability to build enterprise-grade technology solutions has garnered the trust of over 30 Fortune 500 companies, including Siemens, 3M, P&G, and Hershey's. Akash is an early adopter of new technology, a passionate technology enthusiast, and an investor in AI and IoT startups.

Transform Enterprise Processes with AI
Whether you have a defined use case or a process you want to improve, we design and build AI solutions that address operational gaps, enhance existing capabilities, and integrate with your enterprise data, systems, and workflows.
Start a conversation by filling the form
Once you let us know your requirement, our technical expert will schedule a call and discuss your idea in detail post sign of an NDA.
All information will be kept confidential.
FAQs
What is AI in sales forecasting?
AI in sales forecasting is the use of AI capabilities such as anomaly detection, classification, time-series analysis, machine learning, document intelligence, relationship analysis, scenario modeling, and natural-language generation to support forecasting activities.
It can help inspect pipeline quality, evaluate deal evidence, estimate close probability and timing, identify concentration and coverage risk, forecast renewals and consumption, reconcile sales and finance views, and analyze forecast accuracy.
AI should support the forecast decision rather than become the unreviewed authority for commit calls, financial treatment, or external guidance.
Which AI use cases are most vital in sales forecasting?
The most valuable use cases usually fall into six areas:
Forecast integrity: category calibration, close-date validation, stale-opportunity detection, duplicate-value checks, and snapshot-quality controls.
Deal inspection: MEDDPICC evidence review, single-threading analysis, close-plan validation, slipped-deal analysis, and commit-risk packets.
Prediction: weighted pipeline, propensity-to-close models, expected close-date prediction, time-series baselines, and human-model reconciliation.
Risk: pipeline coverage, top-deal concentration, slip scenarios, downgrade scenarios, and persistent over- or under-forecast patterns.
Recurring and usage revenue: renewal waterfalls, churn and contraction forecasting, GRR/NRR projection, commitment drawdown, overage prediction, and consumption curves.
Forecast governance: sales-to-finance reconciliation, executive forecast preparation, snapshot-based accuracy analytics, category calibration, and model monitoring.
The right starting point depends on point-in-time data quality, forecast materiality, historical outcome labels, review boundaries, and the ability to measure whether the use case improves decisions.
What is the difference between a sales forecast and a revenue forecast?
A sales forecast commonly estimates commercial outcomes such as bookings, ARR, ACV, renewals, expansion, or expected deal closures.
A finance revenue forecast estimates when and how revenue is expected to be recognized or otherwise reported according to the organization’s accounting and planning methodology.
A deal can therefore appear in the sales forecast without producing the same amount of recognized revenue in the same period. ASC 606 and IFRS 15 apply revenue-recognition principles based on customer contracts and performance obligations.
The two forecasts should be reconciled, not treated as interchangeable.
Can AI automatically set or approve the official sales forecast?
AI can calculate an independent prediction, propose category changes, identify risks, prepare scenario tables, and draft a forecast submission.
The official forecast should remain tied to defined accountable roles. The account executive confirms opportunity facts, the first-line sales manager reviews deal calls, regional leadership owns regional judgment, and the chief revenue officer owns the sales forecast.
Where the forecast affects finance planning or external guidance, FP&A, revenue accounting, the CFO, and other authorized roles retain their respective responsibilities.
How should organizations measure forecast accuracy?
Forecast accuracy should be measured against point-in-time submissions captured at consistent horizons. Useful measures include:
- Absolute forecast error.
- Signed forecast error to identify systematic over- or under-forecasting.
- Accuracy by forecast horizon.
- Commit and best-case conversion.
- Close-date slip rate.
- Amount-change variance.
- Manager and regional calibration.
- Probability calibration for predictive models.
- Forecast error by segment, product, deal size, and selling motion.
The most important control is snapshot discipline. Historical accuracy should not be calculated from opportunity records that were edited after the forecast date.
What data and systems are needed for AI in sales forecasting?
The required data depends on the selected sub-process. Common sources include:
- Opportunity records and stage history.
- Forecast category history.
- Point-in-time pipeline snapshots.
- Weekly forecast submissions.
- Commit lists.
- Quota and target records.
- MEDDICC or MEDDPICC scorecards.
- Mutual action plans and close plans.
- Commercial approval records.
- Approved engagement summaries.
- Renewal schedules and recurring-revenue records.
- Customer usage or consumption data.
- FP&A bookings plans.
- Revenue schedules and finance assumptions.
- Forecast accuracy reports.
Typical system categories include the CRM system, forecasting data store, contract repository, communication-evidence repository, customer account system, usage-data platform, FP&A planning system, revenue accounting environment, data warehouse, analytics environment, and board reporting repository.
Access should be restricted to the data needed for the approved forecasting purpose.
Where should an organization begin with AI in sales forecasting?
Start with a bounded sub-process that already has point-in-time evidence and an accountable reviewer.
Strong starting points include:
- Close-date drift detection.
- Stale-pipeline review.
- Commit-deal inspection packets.
- Weekly forecast change decomposition.
- Human-model forecast reconciliation.
- Renewal waterfall preparation.
- Forecast risk scenario analysis.
- Snapshot-based accuracy reporting.
Before expanding the workflow, validate it against routine cases, quarter-end exceptions, slipped deals, large-deal concentration, missing data, manager overrides, segment differences, and model drift.
How does ZBrain support AI in sales forecasting?
ZBrain is a governance-first enterprise agentic AI orchestration platform that helps organizations analyze, design, build, deploy, and govern AI solutions across business functions. It supports the end-to-end AI solution lifecycle through four connected modules:
ZBrain Analyzer: Examines the selected forecasting process, gathers inputs from functional team members, maps artifacts, systems, roles, data, controls, and review boundaries, and identifies suitable AI opportunities.
ZBrain Design: Converts the selected use case into a build-ready technical design covering workflow logic, data flows, integrations, model inputs, deterministic checks, human checkpoints, exception paths, permissions, validation criteria, and governance requirements.
ZBrain Solution Builder: Enables teams to create, configure, and validate governed AI workflows for pipeline inspection, prediction, scenario review, renewal forecasting, consumption forecasting, finance reconciliation, and accuracy analytics.
ZBrain Governance: Keeps production workflows registered and applies runtime policies, access controls, approval requirements, escalation controls, monitoring, and audit trails across model outputs, reviewer actions, exceptions, and authorized system updates.
Together, these stages help revenue organizations introduce AI into forecasting while preserving human accountability for forecast submissions, commercial judgments, financial treatment, and external guidance.
Insights

AI in product lifecycle management: A paradigm shift in innovation and execution
AI in product lifecycle management enhances problem-solving capabilities, enabling product managers to decipher complexities, anticipate future trends, and mitigate risks effectively.

AI for financial document processing: Enhancing accuracy and speed
In the financial landscape, AI-powered document processing emerges as a key tool, reshaping the way institutions handle and derive insights from various financial documents.
AI in Contact Center Operations: Use Cases & Agentic Workflows
Explore how AI supports contact center operations across routing, workforce management, quality assurance, coaching, compliance, escalation, and performance governance.